








A questionable collision claim rarely arrives with a label attached. It may look like a routine rear-end loss, a tow invoice that is slightly above market, or a repair plan that changes after teardown. This insurer fraud detection case study examines how a carrier can identify higher-risk claims without slowing legitimate policyholders, creating friction with repair partners, or turning every supplement into a suspicion event.
The case is a composite based on recurring operating patterns across auto claims. Its value is not in a single fraud tactic. It is in showing how claims organizations can connect data signals, adjust workflows, and give special investigation units more actionable referrals while preserving repair-cycle-time discipline.
The operating problem: leakage hidden inside normal claims activity
A regional auto insurer had seen physical damage severity rise faster than its written premium base across several urban markets. Inflation, parts constraints, advanced driver-assistance systems, higher labor rates, and longer rental durations were all legitimate contributors. The challenge was that these macro drivers also made abnormal claims behavior harder to isolate.
The carrier’s existing fraud controls were largely rules-based. Claims were scored when they met defined thresholds, such as a policy written shortly before the loss, a vehicle with prior salvage history, repeated claimant contact information, or an injury allegation inconsistent with the reported impact. Those controls found obvious cases, but they generated a substantial referral volume with uneven quality.
Adjusters faced a second problem. A claim flagged by a generic rule often gave them no practical explanation of what to do next. Was the concern staged loss indicators, inflated towing and storage charges, repair estimate manipulation, duplicate billing, document irregularities, or a possible organized network? Without context, some adjusters over-escalated files while others worked around the alert to keep cycle time moving.
For leadership, the financial issue was not simply paid fraud. It was claims leakage, including unnecessary investigative expense, delayed settlement on legitimate losses, avoidable rental days, and strained relationships with direct repair program facilities that felt scrutinized without a clear basis.
Building a fraud model around claim behavior
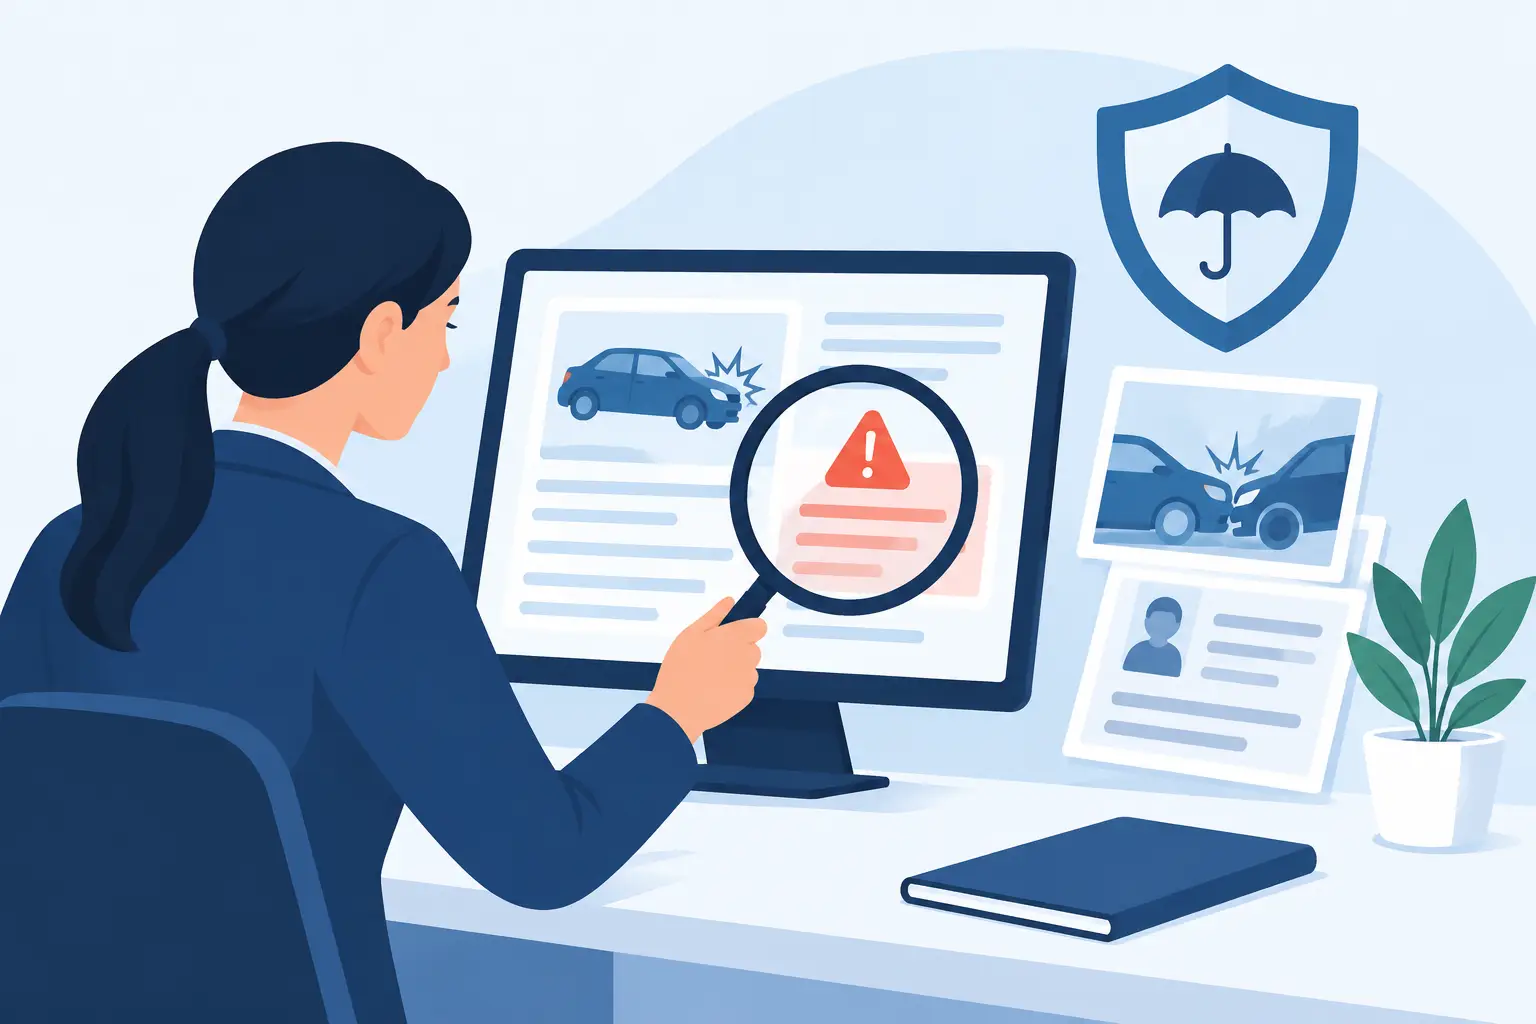
The insurer replaced its single alert queue with a triage model that combined structured claim data, network relationships, and adjuster observations. The goal was not to automate a fraud finding. It was to prioritize files where a focused human review could change the claim outcome.
The model grouped signals into three operating categories: policy and loss timing, transaction behavior, and entity connections. Policy and loss timing included indicators such as recent coverage changes, prior loss patterns, garaging inconsistencies, and loss reports that changed materially over the first 48 hours. Transaction behavior captured estimate revisions, unusual invoice sequencing, rental extensions, storage accrual, total-loss valuation disputes, and payment-routing exceptions.
Entity connections proved especially useful. Rather than assessing a repair facility, tow operator, medical provider, claimant, vehicle, or attorney as an isolated record, the insurer mapped repeated associations across claims. A single connection did not establish misconduct. Several unusual connections, combined with claim-level signals, could justify a more deliberate review.
That distinction mattered. Collision repair businesses often appear repeatedly in claim data because they serve a defined geography, participate in a DRP, specialize in certain makes, or have a strong fleet relationship. High volume is not a fraud signal. The relevant question is whether a pattern departs from peer activity after accounting for market, vehicle mix, repair complexity, and normal business concentration.
A score is a routing tool, not a claim decision
The carrier established three handling paths. Lower-risk claims continued through normal fast-track workflows. Mid-range claims received an adjuster prompt identifying the specific inconsistency to verify, such as obtaining original tow documentation or confirming the timeline of a prior repair. Higher-risk claims went to a fraud specialist for pre-payment review, with SIU involvement reserved for files meeting defined evidentiary and jurisdictional thresholds.
This operating design kept the model from becoming a black box. Adjusters could see the factors that drove a referral and document whether those factors were resolved, substantiated, or explained by ordinary claim circumstances. SIU investigators received a concise case package rather than a raw score and a large file dump.
The carrier also set service-level expectations. A high-risk referral could not sit untouched while storage charges, rental expense, or customer frustration accumulated. Fraud specialists had defined response windows, and claims leaders monitored both investigative outcomes and operational delay.
What the review found
Within the first six months, the carrier found that a meaningful share of high-scoring files had legitimate explanations. A cluster of late-reported losses, for example, came from policyholders whose vehicles had been towed after a weather event and were difficult to access. Several high-cost estimates reflected ADAS calibration requirements on newer vehicles, not inflated repair operations.
That result was productive, not disappointing. It prevented the organization from treating correlation as proof and exposed weaknesses in source data. The carrier refined its rules to account for catastrophic weather declarations, vehicle trim-level equipment, and local storage-rate conditions.
The remaining cases produced clearer intervention opportunities. In one market, investigators identified repeated connections among a small group of claimants, a tow dispatch number, and similar accident narratives. In another, data showed invoice patterns where administrative charges appeared only after a claim entered a particular handling stage. The issue was not that every invoice was improper. The pattern gave investigators a defined set of documents, contacts, and payment records to examine.
The insurer measured results beyond closed fraud referrals. It tracked prevented or reduced indemnity, recovery potential, referral acceptance rates, days from flag to initial review, rental duration on referred files, and the rate at which alerts were cleared without adverse action. That scorecard made an operational trade-off visible: an aggressive model could produce more alerts while generating less value if it delayed too many valid claims.
Effects on repair networks and claims partners
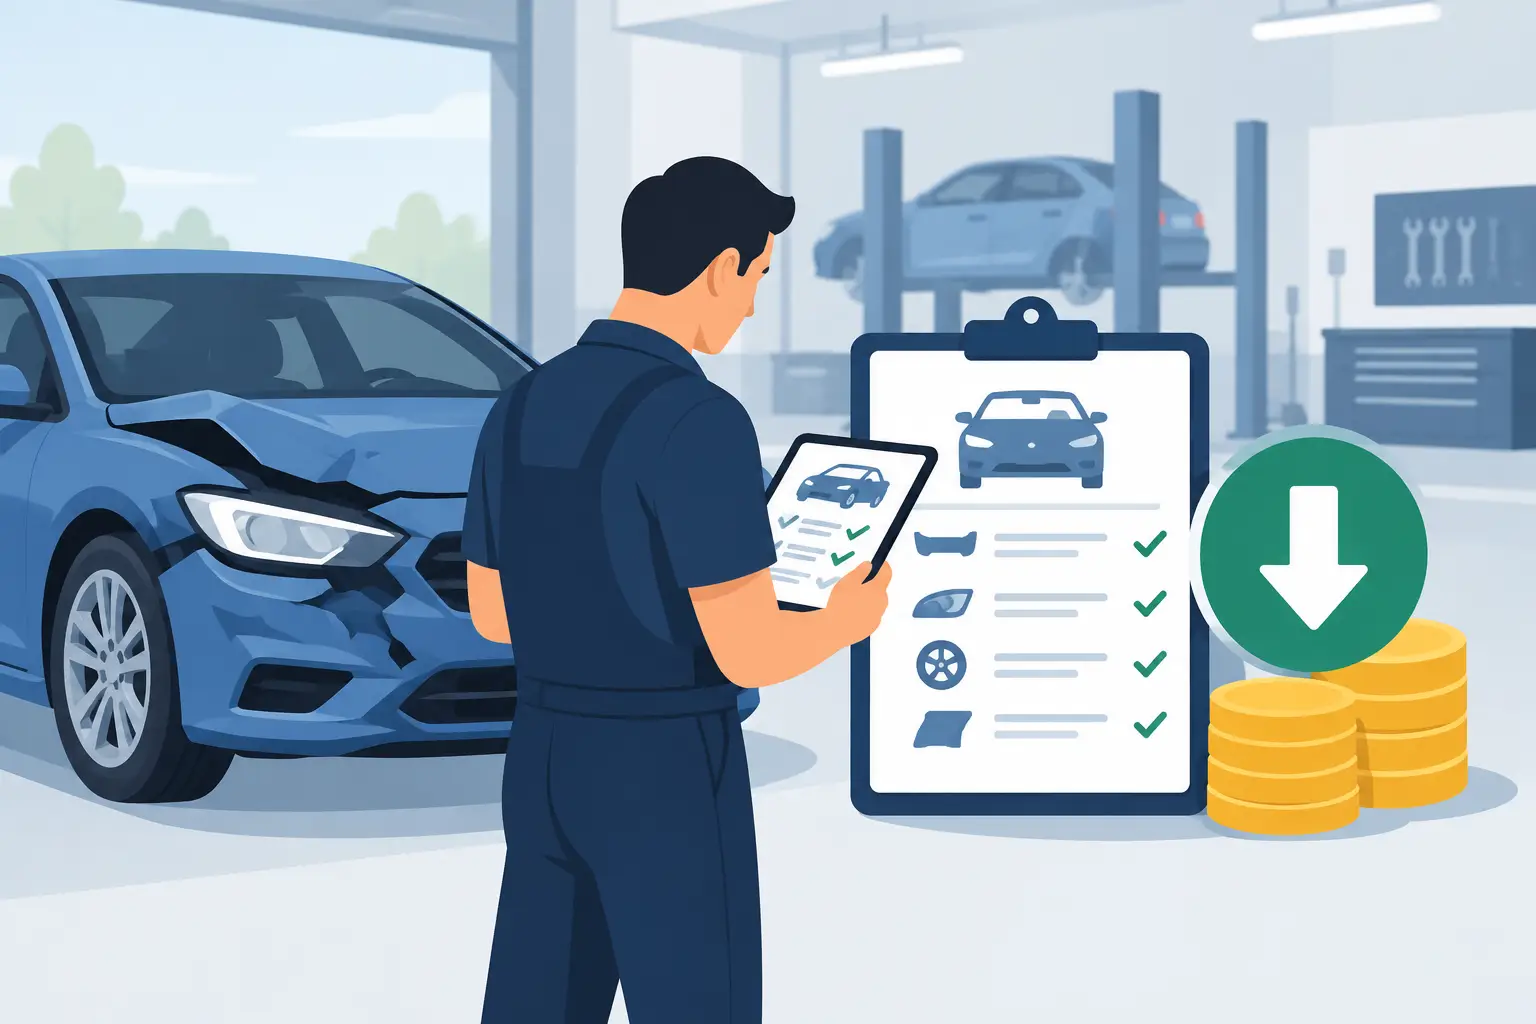
For collision repair operators, fraud analytics can become a relationship issue quickly. A facility that receives repeated documentation requests or delayed approvals may view the carrier as difficult to work with, especially when parts availability, scans, calibrations, and technician capacity are already affecting throughput.
The carrier addressed this through process discipline rather than broad disclosure of investigative methods. Repair partners were given clearer expectations for photo documentation, sublet records, calibration invoices, tow and storage support, and supplement narratives. When a file required additional review, the claims team communicated the needed documentation and expected turnaround rather than making generalized accusations.
This approach also improved the carrier’s internal estimating quality. Some referrals initially triggered by estimate variance were resolved after adjusters confirmed that the estimate database had lagged local labor conditions or that a repair required operations not captured in an early photo estimate. Fraud controls became a feedback channel for claims accuracy, not just a loss-prevention function.
Lessons from the insurer fraud detection case study
The strongest lesson is that fraud detection performs best when it is integrated with claim operations. A model that only identifies suspicious files will create noise. A model that explains why a file needs review, assigns the right next action, and measures the time cost of that action can improve both leakage control and customer handling.
Data quality also determines how far automation can go. Vehicle identification data, policy history, estimate line items, payment information, vendor records, images, and notes must be consistent enough to support comparison. A carrier with fragmented claim platforms may get more value from improving data capture and referral workflow before investing heavily in advanced analytics.
Finally, the threshold should vary by exposure. A $1,200 property damage claim, a complex commercial vehicle loss, and a high-severity bodily injury claim do not warrant identical review logic. Claims leaders should calibrate detection against potential financial impact, customer harm, regulatory obligations, and the availability of investigative resources.
For insurers, repair networks, and technology providers, the practical opportunity is not to eliminate judgment from claims. It is to direct judgment where the facts warrant it, protect legitimate repairs from unnecessary delay, and make every referral specific enough that the next person in the workflow knows what to verify.